MacBook statistics are usually reported as part of Apple’s broader Mac segment (MacBook Air, MacBook Pro, iMac, Mac mini, Mac Studio, and Mac Pro). That means most “MacBook” market numbers you’ll see are really Mac revenue, shipments, or market share—still useful for tracking demand for Apple laptops, but not a perfect one-to-one proxy.
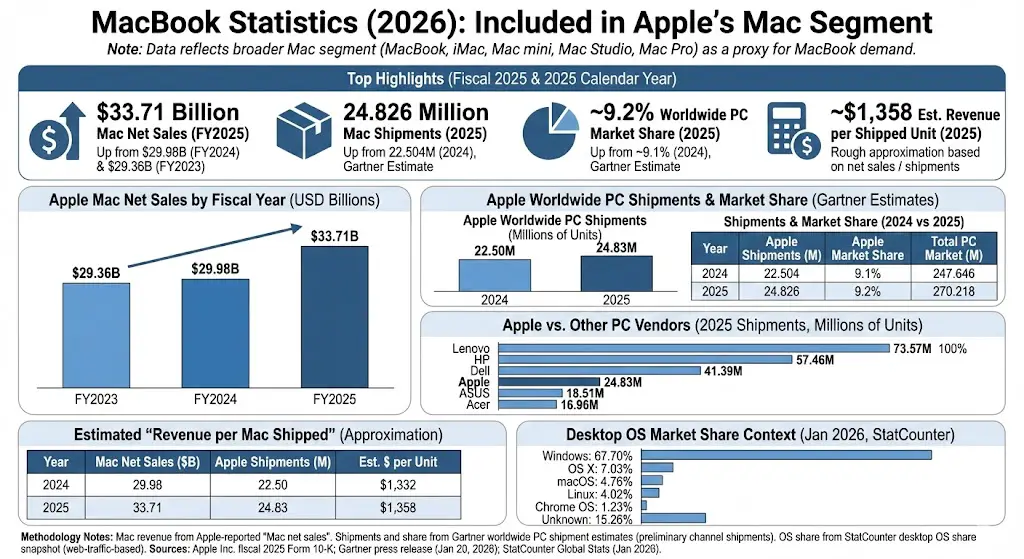
Apple reported $33.708 billion in Mac net sales in fiscal 2025, up from $29.984 billion in fiscal 2024.
Mac net sales were $29.357 billion in fiscal 2023 (showing multi-year stability before the 2025 jump).
Mac represented about 8.10% of Apple’s total net sales in fiscal 2025 (vs. 7.67% in 2024).
Gartner estimated Apple shipped 24.826 million PCs worldwide in 2025 (about 9.2% market share), up from 22.504 million in 2024 (about 9.1% share).
In Q4 2025, Gartner estimated Apple shipped 6.689 million PCs worldwide (about 9.4% share).
Gartner estimated the total worldwide PC market reached 270.218 million shipments in 2025, up from 247.646 million in 2024.
Based on Apple’s Mac net sales and Gartner’s Mac/PC shipment estimates, the estimated average Mac revenue per shipped unit was about $1,358 in 2025 (rough approximation; not a reported Apple metric).
StatCounter’s worldwide desktop OS snapshot for January 2026 shows macOS at 4.76% and OS X at 7.03% (two Apple desktop OS labels tracked separately in that view).
Apple Mac Revenue (A Core “MacBook Demand” Signal)
Apple’s reported Mac net sales are one of the cleanest top-down signals for MacBook demand because MacBooks are a major portion of the Mac line. Apple also notes Mac net sales changes are driven by laptop and desktop mix (Apple does not publicly break out MacBook revenue separately).
Chart: Apple Mac Net Sales by Fiscal Year (USD, Billions)
Label
Bar
Value
FY2023
$29.36B
FY2024
$29.98B
FY2025
$33.71B
Max = 33.71. Widths: FY2023 87.09%, FY2024 88.95%, FY2025 100.00%.
Apple Mac Shipments and Market Share (Gartner)
Apple doesn’t publish unit sales for MacBooks/Macs, so third-party PC trackers are the standard way to estimate shipments. Gartner’s worldwide PC shipment estimates include desktops and laptops running Windows, macOS, and Chrome OS (so “Apple shipments” here effectively represent Mac shipments into the channel).
Chart: Apple Worldwide PC Shipments (2024 vs 2025, Millions of Units)
Label
Bar
Value
2024
22.50M
2025
24.83M
Max = 24.83. Widths: 2024 90.65%, 2025 100.00%.
Table: Apple PC Shipments and Worldwide Market Share (Gartner)
Year
Apple Shipments (Millions)
Apple Market Share
Total PC Market (Millions)
2024
22.504
9.1%
247.646
2025
24.826
9.2%
270.218
Apple vs Other PC Vendors (2025 Shipments)
This view helps put MacBook (Mac) volume in context. Even at ~9% share, Apple is competing in a market where Lenovo, HP, and Dell ship substantially more units worldwide.
Chart: Worldwide PC Shipments by Vendor (2025, Millions of Units)
Label
Bar
Value
Lenovo
73.57M
HP
57.46M
Dell
41.39M
Apple
24.83M
ASUS
18.51M
Acer
16.96M
Max = 73.57. Widths: Lenovo 100.00%, HP 78.10%, Dell 56.26%, Apple 33.75%, ASUS 25.16%, Acer 23.06%.
Estimated “Revenue per Mac Shipped” (Approximation)
This is a rough calculation that divides Apple’s reported Mac net sales by Gartner’s estimated Apple PC shipments. It’s useful for directional comparisons (year to year), but it is not the same as an average selling price because it blends laptops/desktops, includes channel effects, and depends on third-party shipment estimates.
Year
Mac Net Sales (USD, Billions)
Apple Shipments (Millions)
Estimated USD per Shipped Unit
2024
29.98
22.50
$1,332
2025
33.71
24.83
$1,358
Desktop OS Market Share Context (MacBook Ecosystem Signal)
MacBook demand is also tied to the broader desktop/laptop ecosystem. One public proxy is desktop operating system share (measured from web traffic samples), which helps contextualize the installed base trend even though it’s not a direct measure of sales.
Desktop OS (Worldwide)
Share (Jan 2026)
Windows
67.70%
OS X
7.03%
macOS
4.76%
Linux
4.02%
Chrome OS
1.23%
Unknown
15.26%
Methodology Notes
Mac revenue: Apple-reported “Mac net sales” (includes MacBook + desktop Macs).
Shipments and share: Gartner worldwide PC shipment estimates (channel shipments; preliminary estimates may be revised).
OS share: StatCounter desktop OS share snapshot (web-traffic-based measurement, not a census).
Sources
Apple Inc. fiscal 2025 Form 10-K (Products and Services Performance table; Mac net sales for 2023–2025)
Gartner press release (Jan 20, 2026): Preliminary Worldwide PC Vendor Unit Shipment Estimates (4Q25 and full-year 2025)
StatCounter Global Stats: Desktop Operating System Market Share Worldwide (Jan 2026)