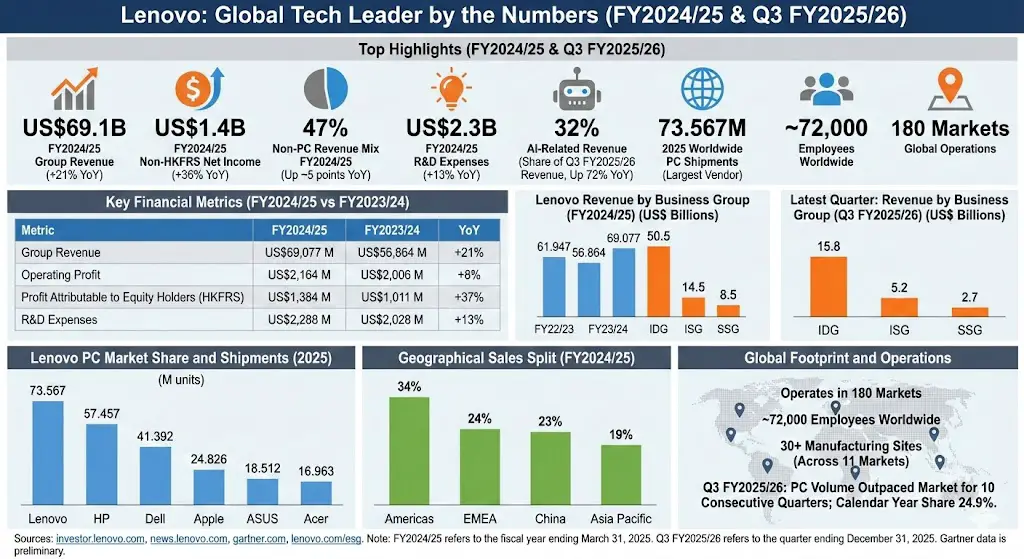
Lenovo statistics highlight how Lenovo has grown into a global tech leader spanning PCs, smartphones (Motorola), servers, and services—while keeping its #1 position in worldwide PC shipments.
US$1.4B FY2024/25 non-HKFRS net income (+36% YoY).
47% non-PC revenue mix in FY2024/25 (up ~5 points YoY).
US$2.3B FY2024/25 R&D expenses (+13% YoY).
FY2024/25 business group revenue: IDG US$50.5B, ISG US$14.5B, SSG US$8.5B.
US$22.2B revenue in Q3 FY2025/26 (+18% YoY); US$546M net income; US$589M adjusted net income.
AI-related revenue was 32% of Q3 FY2025/26 revenue, up 72% YoY.
2025 worldwide PC shipments: Lenovo 73.567M units (largest vendor).
Workforce & reach: ~72,000 employees; operations across 180 markets.
Lenovo revenue by fiscal year (US$ billions)
Lenovo’s FY2024/25 revenue rebounded strongly, reaching its second-highest level in company history.
Fiscal year
Bar
Revenue (US$B)
FY22/23
61.947
FY23/24
56.864
FY24/25
69.077
Max = 69.077. Widths: FY22/23 89.68%, FY23/24 82.32%, FY24/25 100.00%.
Key financial metrics (FY2024/25 vs FY2023/24)
Metric (US$ millions)
FY2024/25
FY2023/24
YoY
Group revenue
69,077
56,864
+21%
Operating profit
2,164
2,006
+8%
Profit attributable to equity holders (HKFRS)
1,384
1,011
+37%
R&D expenses (included in operating expenses)
2,288
2,028
+13%
Lenovo revenue by business group (FY2024/25)
Lenovo reports results across three core groups: Intelligent Devices Group (IDG), Infrastructure Solutions Group (ISG), and Solutions and Services Group (SSG).
Business group
Bar
Revenue (US$B)
IDG
50.5
ISG
14.5
SSG
8.5
Max = 50.5. Widths: IDG 100.00%, ISG 28.71%, SSG 16.83%.
Lenovo PC market share and shipments (2025)
Lenovo led worldwide PC vendor shipments in 2025, according to Gartner’s preliminary full-year estimates.
Vendor
Bar
2025 shipments (M units)
Lenovo
73.567
HP
57.457
Dell
41.392
Apple
24.826
ASUS
18.512
Acer
16.963
Max = 73.567. Widths: Lenovo 100.00%, HP 78.10%, Dell 56.26%, Apple 33.75%, ASUS 25.16%, Acer 23.06%.
Latest quarter: revenue by business group (Q3 FY2025/26)
Lenovo reported a record fiscal quarter revenue of US$22.2B in Q3 FY2025/26, with all major groups growing double-digit year-on-year.
Business group
Bar
Q3 FY2025/26 revenue (US$B)
IDG
15.8
ISG
5.2
SSG
2.7
Max = 15.8. Widths: IDG 100.00%, ISG 32.91%, SSG 17.09%.
Geographical sales split (FY2024/25)
Lenovo’s FY2024/25 sales were globally diversified across major regions.
Region
Bar
Share of sales (%)
Americas
34
EMEA
24
China
23
Asia Pacific
19
Max = 34. Widths: Americas 100.00%, EMEA 70.59%, China 67.65%, Asia Pacific 55.88%.
Global footprint and operations
Lenovo operates across 180 markets and has approximately 72,000 employees worldwide.
Its manufacturing footprint includes 30+ manufacturing sites (in-house or outsourced) across 11 markets.
In Q3 FY2025/26, Lenovo reported that PC volume outpaced the market for 10 consecutive quarters, with calendar-year PC market share at 24.9% and quarterly share at 25.2%.