Intel statistics matter because Intel sits at the intersection of PC demand, data center spending, and one of the most capital-intensive manufacturing roadmaps in tech. Below is a data-first snapshot of Intel’s scale, financial performance, segment mix, geography, R&D intensity, headcount, and capital spending (based on Intel’s fiscal year ended Dec 27, 2025).
Intel statistics (top highlights)
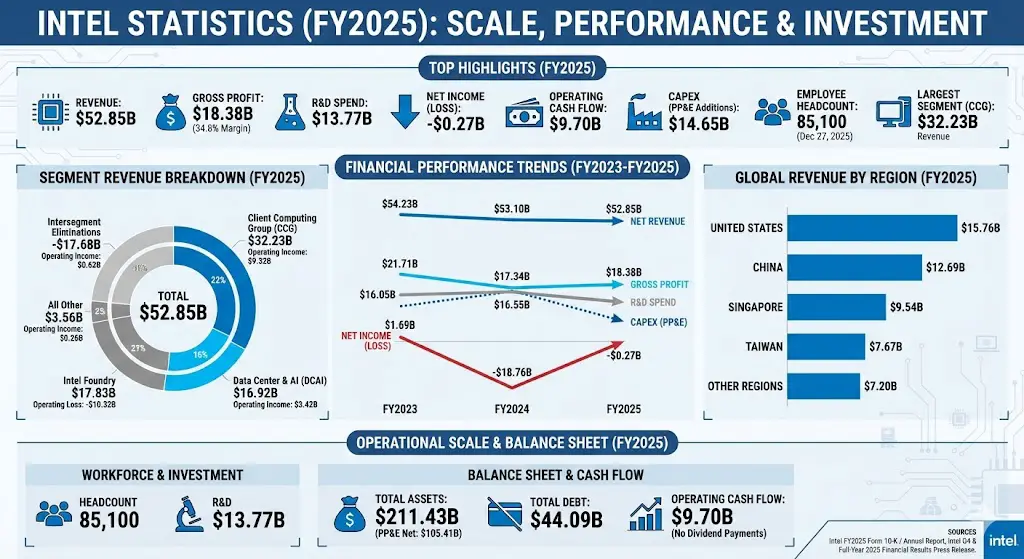
- FY2025 revenue: $52.85B
- FY2025 gross profit: $18.38B (34.8% gross margin)
- FY2025 R&D spend: $13.77B
- FY2025 net income (loss) attributable to Intel: -$0.27B
- FY2025 operating cash flow: $9.70B
- FY2025 capex proxy (additions to property, plant & equipment): $14.65B
- Employee headcount: 85,100 (as of Dec 27, 2025)
- Largest operating segment by revenue (FY2025): Client Computing Group (CCG) at $32.23B
- Top 3 customer concentration (FY2025): 43% of net revenue
Intel financial performance statistics
Intel’s FY2025 results show a $52.85B revenue base alongside heavy R&D and manufacturing investment. Profitability and net income can swing materially year to year due to restructuring, depreciation, and other non-operating items, so it helps to track multiple years together.
| Metric (US$) | FY2023 | FY2024 | FY2025 |
|---|---|---|---|
| Net revenue | $54.23B | $53.10B | $52.85B |
| Gross profit | $21.71B | $17.34B | $18.38B |
| Research & development | $16.05B | $16.55B | $13.77B |
| Operating income (loss) | $0.09B | -$11.68B | -$2.21B |
| Net income (loss) attributable to Intel | $1.69B | -$18.76B | -$0.27B |
| Operating cash flow | $11.47B | $8.29B | $9.70B |
| Capex proxy (additions to PP&E) | $25.75B | $23.94B | $14.65B |
Note: Dollar figures above are rounded from Intel’s reported amounts (in millions) for FY2023–FY2025.
Intel segment revenue statistics (FY2025)
Intel reports multiple operating segments. In FY2025, the Client Computing Group (CCG) generated the largest revenue among reportable segments, followed by Data Center and AI (DCAI). Intel also reports Intel Foundry, which includes internal manufacturing activity (with intersegment eliminations shown separately).
| Segment / line item | FY2025 revenue | FY2025 operating income (loss) |
|---|---|---|
| Client Computing Group (CCG) | $32.23B | $9.32B |
| Data Center and AI (DCAI) | $16.92B | $3.42B |
| Intel Foundry | $17.83B | -$10.32B |
| All Other | $3.56B | $0.26B |
| Intersegment eliminations | -$17.68B | $0.62B |
| Total consolidated | $52.85B | -$2.21B |
Intel revenue by region (FY2025)
This chart shows FY2025 net revenue by customer billing location. The values are Intel’s reported amounts converted to billions for readability.
| Region | Bar | FY2025 net revenue | ||
|---|---|---|---|---|
| United States |
| $15.76B | ||
| China |
| $12.69B | ||
| Singapore |
| $9.54B | ||
| Taiwan |
| $7.67B | ||
| Other regions |
| $7.20B |
Max = $15.76B. Widths: United States 100.00%, China 80.56%, Singapore 60.51%, Taiwan 48.69%, Other regions 45.66%.
Intel workforce and R&D statistics
Intel reported an employee headcount of 85,100 as of Dec 27, 2025. On the spending side, Intel reported $13.77B in R&D expense in FY2025 (down from FY2024), reflecting the scale of ongoing CPU, AI, packaging, and process technology investment.
Intel cash flow and capex statistics
In FY2025, Intel generated $9.70B in cash from operating activities. Intel also reported $14.65B in additions to property, plant and equipment (a capex proxy), reflecting continued manufacturing and capacity investment. Intel’s FY2025 cash flow statement also shows no dividend payments to stockholders during the year.
Balance sheet scale statistics
At fiscal year-end (Dec 27, 2025), Intel reported $211.43B in total assets, including $105.41B in property, plant and equipment (net). Total debt was reported at $44.09B.
Quick FAQ
What was Intel’s revenue in 2025?
Intel reported FY2025 net revenue of about $52.85B.
How many employees does Intel have?
Intel reported an employee headcount of 85,100 as of Dec 27, 2025.
Which Intel segment is largest by revenue?
In FY2025, Intel’s Client Computing Group (CCG) had the largest segment revenue at about $32.23B.
Sources
- Intel FY2025 Form 10-K / Annual Report (year ended Dec 27, 2025): https://fortune.com/company-assets/1647/quartr/annual-report-10-k-dd198-2026-01-23-11-07-03.pdf
- Intel Q4 and Full-Year 2025 financial results (press release): https://www.intc.com/news-events/press-releases/detail/1759/intel-reports-fourth-quarter-and-full-year-2025-financial
- Intel appoints Lip-Bu Tan as CEO (press release): https://www.intc.com/news-events/press-releases/detail/1730/intel-appoints-lip-bu-tan-as-chief-executive-officer