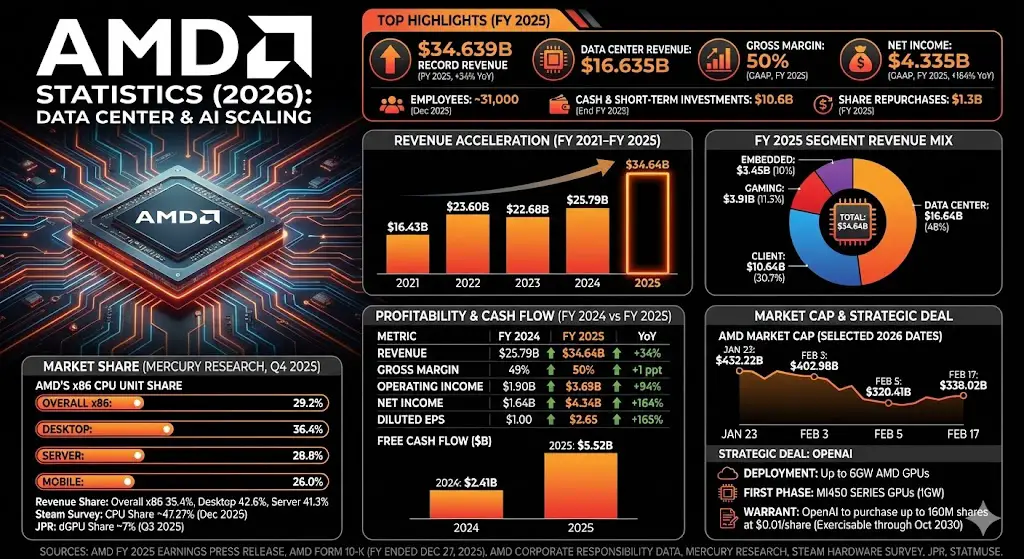
AMD statistics show how fast the company is scaling in data center and AI while still growing its PC CPU footprint and improving profitability. The numbers below focus on AMD’s latest full-year results (FY 2025), market-share checkpoints, and current market-cap snapshots.
In FY 2025, AMD’s Data Center segment led revenue, with Client, Gaming, and Embedded making up the remainder.
Segment Revenue (FY 2025)
Segment
Bar
Revenue ($B)
Data Center
16.64
Client
10.64
Gaming
3.91
Embedded
3.45
Max = 16.64. Widths: Data Center 100.00%, Client 63.94%, Gaming 23.50%, Embedded 20.76%.
Profitability and Cash Flow Statistics
AMD’s FY 2025 results show higher revenue, higher margins, and sharply higher GAAP net income versus FY 2024.
Key Financial Metrics (GAAP)
Metric
FY 2025
FY 2024
YoY
Revenue ($B)
34.64
25.79
+34%
Gross margin
50%
49%
+1 ppt
Operating income ($B)
3.69
1.90
+94%
Net income ($B)
4.34
1.64
+164%
Diluted EPS
2.65
1.00
+165%
Free Cash Flow (FY 2024 vs FY 2025)
Fiscal Year
Bar
Free Cash Flow ($B)
2024
2.41
2025
5.52
Max = 5.52. Widths: 2024 43.57%, 2025 100.00%.
Liquidity & Balance Sheet (Year-End)
Metric
FY 2025
FY 2024
Cash, cash equivalents & short-term investments
$10.6B
$5.1B
Total debt (principal)
$3.3B
$1.8B
AMD Market Share Statistics
AMD’s most-cited market share benchmarks come from Mercury Research (x86 CPU share) and JPR (add-in-board GPU share).
AMD x86 CPU Unit Share (Mercury Research, Q4 2025)
Segment
Bar
Unit Share
Desktop
36.4%
Overall x86
29.2%
Server
28.8%
Mobile
26.0%
Max = 36.4%. Widths: Desktop 100.00%, Overall x86 80.22%, Server 79.12%, Mobile 71.43%.
Mercury Research figures also indicate AMD reached 35.4% x86 CPU revenue share in Q4 2025, with desktop CPU revenue share reported at 42.6% and server CPU revenue share at 41.3% in the same quarter.
On the consumer side, Steam survey reporting (as covered by Tom’s Hardware) put AMD’s CPU share at 47.27% after a strong jump in December 2025.
For add-in-board (graphics card) market share, JPR figures (as reported by Tom’s Hardware) showed AMD at 7% dGPU market share in Q3 2025.
AMD Stock & Valuation Statistics
AMD’s market capitalization changes daily with its share price and shares outstanding. The snapshot below uses market cap figures for selected 2026 trading days.
AMD Market Cap (Selected Dates in 2026)
Date
Bar
Market Cap ($B)
Jan 23, 2026
432.22
Feb 3, 2026
402.98
Feb 5, 2026
320.41
Feb 17, 2026
338.02
Max = 432.22. Widths: Jan 23, 2026 100.00%, Feb 3, 2026 93.23%, Feb 5, 2026 74.13%, Feb 17, 2026 78.20%.
As another valuation checkpoint from AMD’s filings, the company reported the aggregate market value of AMD common stock held by non-affiliates at approximately $232.3B as of June 28, 2025 (based on a $143.81 closing price on June 27, 2025).
Workforce & Operations Statistics
Employees: approximately 31,000 (global workforce) as of December 27, 2025.
Available revolving credit facility: $3.0B (expires April 29, 2027); no funds drawn during FY 2025.
Unconditional commitments: approximately $12.2B, including $8.5B in fiscal year 2026.
AI, GPUs, and Strategic Deal Statistics
AMD’s filings disclosed a product purchase agreement with OpenAI that includes planned deployment of up to 6 gigawatts of AMD GPUs, with the first gigawatt expected to be powered by AMD Instinct MI450 series GPUs. The arrangement also includes a warrant for OpenAI to purchase up to 160 million shares of AMD common stock at $0.01 per share (subject to vesting conditions) and exercisable through October 5, 2030.
AMD also disclosed that during FY 2025 it recorded approximately $800M of inventory and related charges tied to new U.S. export restrictions on certain semiconductors to China (AMD Instinct MI308 products), and later reversed approximately $360M as it began shipping under granted licenses in Q4 2025.
AMD Corporate Responsibility data tables (revenue history, headcount 2024): https://www.amd.com/en/corporate/corporate-responsibility/data-tables.html
Mercury Research x86 CPU share coverage (Q4 2025): https://www.tomshardware.com/pc-components/cpus/30-percent-of-x86-cpus-sold-are-now-made-by-amd-as-companys-market-share-grows-thanks-to-a-flagging-intel-enjoys-growth-across-all-segments-as-competition-intensifies
Steam Hardware Survey CPU share coverage (December 2025 jump): https://www.tomshardware.com/pc-components/cpus/intel-clawed-back-cpu-market-share-from-amd-in-the-steam-hardware-survey-for-the-first-time-in-months